

As it is extremely time-consuming to visit each of the 650 hectares restored by arboRise to assess the health of the new forests, we sought to measure tree growth remotely. But how to do this? NDVI sentinel 2 is the answer!
The European Union’s Sentinel II satellite takes an infrared photograph of the earth’s soil every 5 days with a resolution of 10m (1 pixel: 10m x 10m = 100m2). The data provide many indications about a region, such as humidity/aridity, the presence of fires, and also the nature of the vegetation. An important advantage is that the data is available free of charge (see Sentinel Playground).
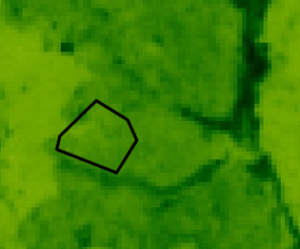
The value we are interested in is the “NDVI” (Normalized Difference Vegetation Index) which corresponds to the rate of vegetation cover on the ground, a good index of the quantity of biomass, therefore an index of the quantity of trees (forests appear clearly on the maps with a darker shade of green).
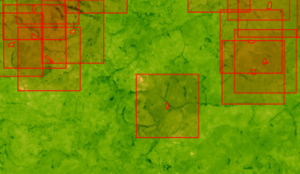
For each reforested area, the NDVI value (= shade of green) of each pixel is extracted and the median value, the biomass of the area, is calculated:
For each reforested plot, we then calculate the median NDVI value of the “background”, an area of 2km side around the plot (by subtracting the NDVI of the plots present in the background):
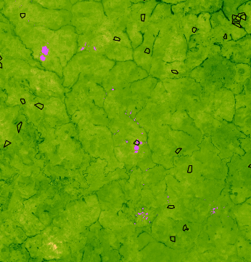
On the basis of the Sentinell II cloud cover index, we then eliminate all values with a probable cloud cover of more than 90% (the purple spots on the image below):
For each available day of data (75 per year) and for each plot, we obtain
- The median NDVI of the plot
- The cloud cover over the plot for that day
- The median NDVI of the background
- The background cloud cover for that day
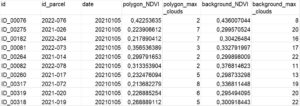 …44815 lines for the period from January 1, 2021 to November 22, 2022…
The graph below represents the NDVI values for 2021 and 2022 over a year. The values of the days where the median background cloudiness on one or more fields was above 90% have been removed:
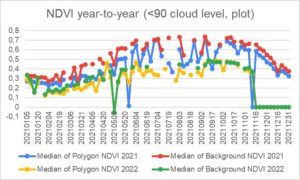
It can be seen that the NDVI in 2022 is lower than the NDVI 2021 (yellow and green lines below the red and blue lines). At this stage three hypotheses are possible:
- It may be a change in the calibration of the satellite or the measurement (but this is unlikely) and this change should then apply uniformly to all 2022 measurements, but the NDVI of the Background decreases significantly more (-0.19) than the NDVI of the Polygons (-0.16)
- 2022 may have been drier than 2021, but this is not confirmed by the local population, who say that 2022 was rainier
- There were more fires and deforestation in 2022…
The reason for this change needs to be investigated. For the time being, annual comparisons should be interpreted with caution.
On the other hand, the effect of the rainy season can be clearly seen:
- A progressive increase in biomass from February to August
- A significant cloud cover between June and October (less data for this period because of clouds)
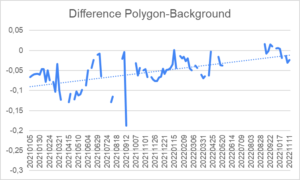
Great news: In 2021 the polygons (arboRise plots) have an average NDVI 5.2% lower than the background NDVI (normal, arboRise reforests bare land), but in 2022 the NDVI of the polygons is 3% higher than the background NDVI! And there is a positive growth in the difference between the biomass of the reforested plots and the biomass of the background, which means that the biomass on the arboRise plots is growing faster than in the surrounding area:
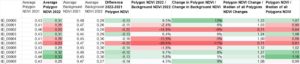
For the reforested areas in 2021, two years of data are available and can be compared: NDVI sentinel 2
The visualization on this graph allows to identify the “good plots” (top right) from the “bad plots” (bottom left):
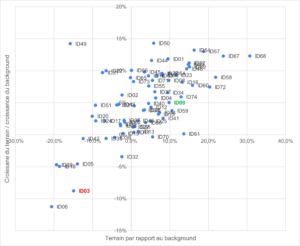
It can be seen that the majority of the plots are located in the upper right part of the graph, which is excellent news!
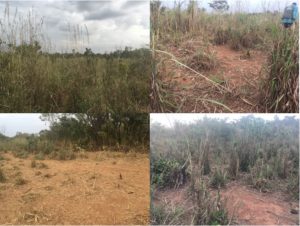
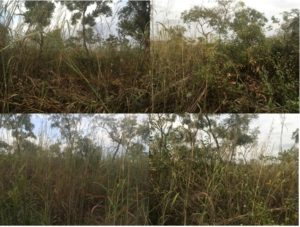
But how well does this satellite analysis match reality? We went to see on the spot what it was like for plots ID03 and ID09.
For the “bad” field n°3, we observe a depleted soil following several years of cultivation. Situated between two hills, it is probably an area where cattle used to transhumance towards a watering place (visible dung). The trampling makes it difficult for the vegetation to grow. However, small shrubs of 1.5m are visible and 4 remnants of trees are completely dry. No sign of fire. This low biomass in the field validates the satellite measurement of NDVI
As for plot 9, it is impossible to enter without a machete because the vegetation is so dense, especially the 3m high grasses. We can see several shrubs of about 2m and 3-4 trees of 8m. The land has obviously not been grazed or burnt. This higher biomass in the field validates the satellite NDVI measurement.
In conclusion, the field observations are consistent with the satellite measurements of biomass. It will of course be necessary to confirm this correlation with other examples.
With the help of these indices provided by the Sentinel II satellite, we will be able to target our visits to areas of high growth, to learn from them and to share these good practices with the owners of the land, whose satellite images indicate that they are less wooded. This will serve as case studies for the training of land families and Community Management Committees.
We also hope to inspire other reforestation projects to use this same technique to assess biomass growth on their plots and become more efficient.
A huge THANK YOU to Sergiy for his expertise in GIS and NDVI sentinel 2 data analysis and his valuable advice!
